Wednesday, September 1, 2021

PARKING REQUIRED

In wilderness is the preservation of the world. ~ Henry David Thoreau   

‘Tis the season. Enjoying open-air parks provides healthful benefits during these pandemic and any other times. This year, after spending much of 2020 sequestered inside, evermore people have decided that enjoying outdoor parks is required, including us. On a regular basis, we go hiking in Tilden Regional Park that beckons several blocks from our home. Tilden is part of the impressive East Bay Regional Park District, which comprises almost 125,000 acres of woodland and trails on the eastern side of the San Francisco Bay. It is the largest urban regional park district in the US.

Humans have been hiking for as long as we’ve been hunting and gathering, which probably started two million years ago. Otzi, the ancient “ice-man,” died while hiking high in the Austro-Italian Alps about 5300 years ago, 5260 years before the fleece jacket was first worn by alpinists. He must have been quite chilly.

More recently, in 1336 the poet Petrarch recounted that he and his brother hiked and climbed for pleasure to the top of Mt. Ventoux, a 6,200ft mountain in southern France. Millions of people have walked on pilgrimages throughout many centuries in pursuit of moral and/or spiritual quests.

The interest in taking a walk through the countryside for its own sake perhaps became more earnest during the 18th century, possibly associated with the rise of Romanticism which elevated the importance of nature.

When cities significantly grew in the during the late 18th century – early-19th century Industrial Revolution, devastating yellow fever, cholera and diphtheria epidemics closely followed. The miasma theory of disease remained prominent and promulgated that diseases were caused by miasma, a toxic form of "bad air.”

Thus, a popular movement became dedicated to increasing “good air” spaces that could provide better public health and refuge from crowded city surroundings. Park-building was a reasoned response to these terrible diseases. Frederick Law Olmsted, whose first child died of cholera, was a significant proponent of such green spaces. In addition to being a landscape architect, he was a public health official. In 1858, Olmsted designed Central Park in New York City, as well as over 100 other public parks across the US.

Folks who want to a walk through the countryside in the 21st century assume tacitly that their journey usually will be on public land, like Tilden Park. But what is a “park”? It can be many things.

There are 22,493 public city parks in the US, according to most recent information. They provide an impressive array of facilities, including golf courses, dog parks, baseball diamonds, basketball hoops and playgrounds for local residents. Chugach Park, mostly within Anchorage, is the US’s largest city park, covering more than 464,000 acres. 

America’s oldest public city park is the Boston Common. Founders of the Massachusetts Bay Colony city bought 50 acres of land from William Blaxton in 1634, allowing families to use it principally as a cow pasture. As folks kept putting additional cows on the common it became overgrazed – a prototypical example of the tragedy of the commons – Colony leaders limited the number of cows to 70 at a time.

Not only cows were using the Common; Ann Hibbins was executed for witchcraft in 1658. Mary Dyer was one of four Quakers hanged in 1660 for defying a law that banned Quakers from the Colony. Genuine park status for the Boston Common arose in 1830, when grazing cows were officially banned and two-legged beings were finally ascendant.

I grew up in Philadelphia, which is home to one of the largest urban parks in the nation. Fairmount Park was developed in 1855 to protect the city’s public water supply and preserve beneficial green spaces within its rapidly-growing industrialization. Fairmount Park is now associated with other Philadelphia parks, including Wissahickon Valley Park. I enjoyed lots of youthful explorations in this park, many with Skeeter, my best buddy. Perhaps the most memorable adventure was the time we found a battered, chrome-plated, one-armed slot-machine of unknown origin lying next to Wissahickon Creek. No, it wasn’t showing 3 aces.

Let’s move up a geographic level and consider state parks. There are over 6,600 public state parks in the US, covering 14 million (M) acres. The oldest state park is claimed by Niagara Falls State Park in NY, established in 1885. However, Georgia’s Indian Springs State Park has been operated since 1825, but did not gain official “state park” status until 1931. Also, in 1864 the federal government ceded Yosemite Valley and Mariposa Grove to be a California state park, which lasted for 26 years. The largest state park in the US is Adirondack Park, founded in 1892. Its 6M acres in northeastern NY include substantial privately-owned inholdings.

The first federal park was created by Congress in 1872 with the Yellowstone National Park Act. Since then, 19 different flavors of federal parks have been created by the National Park Service (NPS), which is part of the Interior Department. Given that the NPS just celebrated its 105th birthday and that there are now 423 federal parks of all types, it’s not that surprising there are so many types. The NPS oversees 84 million acres of land plus over 4 million acres of oceans, lakes and reservoirs. Unlike all the other park types, only Congress can designate a National Park.

These different types of parks include: 63 National Parks, the crown jewel of federal parkdom; 84 National Monuments that are managed by not only by the NPS, but also by the Fish and Wildlife Service (part of the Dept. of Agriculture) and the Bureau of Land Management (part of the Interior Dept.). Among other park types there are 19 National Preserves, 18 National Recreation Areas, including the Golden Gate Recreation Area which was the second most-visited “park” in 2020, and 25 National Battlefields.

The largest US national park is Alaska's Wrangell-St. Elias National Park & Preserve, at 13.2M acres. The largest national park in the world is the Northeast Greenland National Park (NP), created in 1974. This park covers a gigantic 240M acres, which is 2.4x larger than all of California’s bountiful acreage.

We often delight in the notion that the US “invented” the concept of national parks. Franklin D. Roosevelt stated, “There is nothing so American as our national parks.” Although true, it’s mistaken that Yellowstone was the world’s first national park. Nope, 94 years before Yellowstone became a national park, the local Mongolian government of the Qing dynasty created Bogd Khan Uul National Park not far from its capital, Ulaanbaatar. This Park is an impressively distant 9,320 miles from Berkeley. The expanse to Bogd Khan Uul would not even be a medium jaunt plus a few new turns for an Artic Tern, a bird that migrates an Olympian 44,000 miles each year.

Spreading our wings, we recently visited Kings Canyon-Sequoia National Parks in the Sierra Nevada and had a fine time. Sequoia became our second national park in 1890, six days before Yosemite. The picture below of me and our friend Katie shows us on top of the Mark Twain sequoia tree stump in Sequoia NP. That was one huuuuge tree before it was felled in 1891. Slabs of it were sent to the American Museum of Natural History in New York City, the Smithsonian Natural History Museum in Washington, DC and a museum in London to prove that giant sequoias actually existed and weren’t just another “tall tale” from America’s wild west.

Atop the Mark Twain tree stump in Sequoia NP.

Before covid, in 2019 Yosemite had 2.4x as many visitors than Kings Canyon plus Sequoia. It wasn’t always that way; in 1969 Yosemite had only 1.2x as many visitors. The significant increase in Yosemite’s visitors during the past 50 years (93%) has been a conscious NPS policy, requiring substantial investments in human and physical infrastructure. Not all parks’ visitation has grown. Kings Canyon’s 1969 visitation was 1.5x bigger than in 2019. Nevertheless, smaller parks like Kings Canyon and Sequoia that did not receive such added infrastructure are doing fine.

Great Smoky Mountains National Park has been the most-visited park every year since 1944, with 12.1M visitors in 2020; there were 12.5M visitors in 2019. This summer the NPS is dealing with large upsurges in national park attendance as more folks seek gorgeous outside vistas, illustrated in this picture from Utah’s Arches NP.

Arches NP, July 2021.

No matter what local, state, national or international park you visit, for those who want to gain from having a great time hiking, backpacking, swimming or camping outdoors, I wish you many happy trails.


Wednesday, August 11, 2021

The Government’s Fiscal Wheels Turn Very Slowly

There are many ways of going forward, but only one way of standing still. ~ Franklin D. Roosevelt  

Rent checks are still not in the mail. But they might be at some point, thanks to President Biden’s coerced, last-minute agreement on August 3 to again have the CDC extend the covid-based rent payment moratorium for low-income tenants through October 3. One recent guestimate of how much renters owe their landlords surpasses $20 billion; with more than 5.8 million renters in arrears (other estimates say there are 11 million in arrears). That works out to an average back rent of about $3,350 per tenant, which seems small given the length of time some rents haven’t been paid.

Our popular finger-pointing-at-others pastime means hardly anyone beyond the potential recipients is content with this latest, temporary extension. But because these extensions concern a subsidy that many low-income renters clearly have needed, such allowances shouldn’t be surprising at all. Why?

First, subsidies are always needs-based in the eyes of their proponents and recipients, no matter who’s getting the benefit. And second, subsidies are forever. Existing publicly-financed subsidies are rarely annulled. The chart below provides examples of major subsidies – including the biggest, Health Care – that have become institutionalized over many decades. Approximate recent expenditures for each subsidy are also provided. Some folks have argued that several now have diminishing justification.

Subsidy

Year Started / Approximate Annual Amount

Home mortgage

1913. $150B

Energy

1916. $3B (fossil), $11B (renewables), $2.7B (energy efficiency)

Agriculture

1929. $22-$46B

Health Care

1965. $1.5T Medicare-Medicaid & ACA

The US housing market consists of about 141 million total housing units. Growth in the number of housing units has diminished over time as the number of households has levelled off. There were roughly 43 million housing units occupied by renters last year, 30.5% of the total.

In December 2020, Congress passed a pandemic relief package that included $25 billion (B) designed to prevent evictions because of rent non-payment – the Emergency Rental Assistance (ERA) program. Since then, another rental aid package was added this year in March. To date, $46.5B has been available for assistance to low-income renters. The ERA program has been effective. Effectiveness is doing the right thing; providing rental relief is justifiably right.

But the fiscal wheels of government turn very slowly, even when lubricated with subsidies. As of July 31, a meager 7% of this rental assistance aid has been distributed in the US to real renters and their landlords by federal and state agencies. California’s Housing is Key rental relief program has provided only a miniscule 1.2% of the available $5.2B through June.

The ERA program has not been efficient, meaning doing an activity right. It’s been woefully inefficient, to the detriment of all parties. Furious finger-pointing and demonstrations have resulted, including one Congressperson sleeping on the Capitol’s steps.

Should we be upset at this stunningly low program efficiency? Absolutely. Nevertheless, the nature of large, multi-level bureaucracies makes it challenging to operate quickly and efficiently.

The word “bureaucracy” is taken from the French bureaucratie – a verbal blending of “bureau” or desk and “cratie,” conveying a type of government. Agencies filled with desk-bound, mostly well-meaning bureaucrats – French or otherwise – have long been critiqued for their powers that can at times thwart virtuous goals and valued procedures. Bureaucrats also include our elected representatives, who turn out voluminous, inconsistent legislation, sometimes thousands of pages long.[1]

Federal and State agencies too often have been unable to provide prompt responses to many covid-related challenges. Efficiency is simply not a practical bureaucratic goal. It’s hard to imagine how it could be, given the unending challenges that agencies face from authorizing legislation’s specifics and subsequent, overly-complex regulations, let alone needed coordination among the many agencies that have responsibilities for individual facets of an issue like rent relief. The result is confusion for everyone involved with the residential rental market – bureaucrats, renters and landlords.

Federal, state and local government agencies are not quarter horses able to turn quickly on the proverbial legislative/regulatory dime, but more oxen-like. They plod along more or less reasonably and powerfully on established procedural paths they already know. Agencies are usually not able to jump rapidly onto another path that’s not been trod on before (like supplementary covid-based benefits or creating brand-new rent vouchers or reimbursement procedures) that involve only a specified portion of the populous. Rental relief applies only to those folk who are designated as “low-income.”

But the definition of low-income for rental relief is confusingly defined differently than other types of government assistance, which adds to the administrative complications of providing rent aid. “Low-income” renters are folks whose income is equal or less than 80% of the local area median income (AMI). In the beginning, the qualifications- requirements for rent relief also compelled the individual landlord’s compliance. That’s no longer true.

California’s rent relief, like other states, is based on specific AMI levels, not the same as those of Affordable Housing assistance. Affordable Housing’s “low income” is defined separately for each of the state’s 58 counties and by household size.

For Alameda County, where I live, a 3-person household’s income level cannot exceed $94,000, 87.6% of the county’s AMI, to qualify for Affordable Housing. However, to qualify for rent relief in Alameda County, this 3-person household’s income level cannot exceed $85,480, 80% of the AMI. In addition, rent relief requires certification that at least one the household’s tenants must also have lost a job or income during the pandemic and can show they are at risk of homelessness. Many jurisdictions have first been assisting “very low income” renters before helping others.

Many applicants have complained of a clunky, cumbersome system and the lack of translation for non-English speakers as factors inhibiting people from applying for rental aid. Landlords are similarly frustrated with the quickly cobbled together rent relief system. One person who represents landlords of all sizes stated, “You couldn’t create a worse system if you tried.”

Smaller landlords have fared worse than larger, corporate ones. From the Biden administration’s apparent perspective, there are no consequences to repeatedly extending the rent-eviction moratoria. Reality’s consequences include smaller, cash-constrained landlords now selling their properties to larger owners and evictions swelling despite the CDC’s ukases.

Rent relief is another type of subsidy, where qualified tenants are relieved of paying their monthly rent via the government program’s disbursements. There is little doubt that very few low-income renters ultimately will be able to fully pay all of their past-due rent debts. In some states only 12 months of rent debt can be forgiven.

There was a strong case for temporary rent relief in the beginning of the pandemic when millions of people were thrown out of work and the coronavirus was spreading unimpeded, creating a national emergency. The first moratorium began in September 2020. But the economy has since revived to a significant though not complete extent.

Making emergency measures like eviction moratoria permanent is less creditable. This despite progressive Dems arguments that rent assistance should be enduring because overall rents are too high and there’s insufficient affordable housing. Such a long-term eviction moratorium could lead to perverse, unintended consequences like reducing the supply of already-inadequate affordable housing as developers and landlords decide they may not want to rent to folks who could become non-payers.

Here’s hoping we turn the eviction moratorium corner as soon as possible.


[1] The December 2020 Consolidated Appropriations Act was 5,593 pages long, the lengthiest to date. It combined stimulus relief for the covid pandemic and the federal government’s omnibus spending bill for FY2021. The bipartisan Infrastructure Investment and Jobs Act, that the Senate passed on August 10, is a mere 2,702 pages long. Because they’re rapidly assembled piecemeal, no single person has any clear idea what these laws actually cover. 


Monday, July 5, 2021

BRANCHING OUT

Trees are your best antiques. ~ Alexander Smith 

     Even though they have continuously inhabited the Earth for far more than 160 million years, trees are now having a moment of prominence. This moment has nothing to do with the recent, hefty increases in the commercial lumber prices – which are now headed back towards the basement after previously occupying the penthouse for a brief time.

My fascination with dendrology – the study of wooded plants – comes after reading Suzanne Simard’s Finding the Mother Tree and Richard Powers’ The Overstory. These absorbing books are related, each has a focus on trees, forests and related land-use policies. In addition, Mr. Powers modeled one of the protagonists in The Overstory, Patricia Westerford, after Professor Simard and her notable career.

First, some botanical taxonomy. Trees reside in the Plantea kingdom. Two of this kingdom’s phyla contain trees: Coniferophyta (conifers) and Magnoliophyta (flowering plants). Currently, there are about 60,000 known species of deciduous and conifer trees. Deciduous (from the Latin term meaning “to fall”) trees shed their leaves during some parts or seasons of the year. Conifers retain their narrow, long, pointed waxy-coated leaves (aka, needles) throughout the year. They are mostly evergreens and bear seeds within their cones.

The tallest trees on Earth are coastal redwoods, Sequoia sempervirens. I gaze at a baby redwood that's planted within 100ft of our home. The loftiest of which is named Hyperion that reaches 380 feet into the sky at Big Basin Redwoods State Park north of Santa Cruz, CA. It weighs 230 tons and is a youngster of just 600-800 years old. Redwoods can live to be over 2,000 years. In contrast to their size, redwoods produce quite small, one-inch-long cones.

The heftiest trees by volume are giant sequoias, Sequoiadendron giganteum. General Sherman reaches 275 feet into the sky in Sequoia National Park, has an immense 102-foot trunk circumference, is 2,300-2,700 years old and weighs a staggering 1,350 tons. Impressivo.

On another end of the living tree spectrum, the shortest trees in the world are dwarf willows that live in the arctic and subarctic regions of northern Europe, Greenland and eastern Canada. They somehow survive through the bitter 3-4 months of dark by being ground-huggers. Petite dwarf willows grow to a height of 0.4 to 2.4 inches, less than the length of your index finger with not much at all to put Christmas decorations on. These tiny trees thus stay below their landscape’s numerous winter storms’ sub-zero winds in these willows.

The oldest living things alive today above ground are gnarled bristlecone pine trees,[1] shown below. They endure high in California's White Mountains. Even though they can and have lived for about 5,000 years, they (fortunately) haven’t qualified for millennia’s worth of Social Security or Medicare.

Bristlecone pines at 11,190ft.

Let’s leave trees’ physical characteristics and explore how they communicate with each other. Until recently, the thought of trees transferring information among each other would have been judged completely bizarre. Enter Prof. Simard, who is a professor of Forest Ecology at the University of British Columbia.

Her groundbreaking empirical research during the past 25 years has demonstrated conclusively that forested trees can and do exchange information with others nearby. This communication is facilitated via the trees’ subsurface, interlaced root and mycorrhizal (fungal) networks. These impressive, multi-layered networks between inter-dependent trees exchange carbon, water, nutrients and defense signals about drought and disease. In addition to her book, she has given several TED talks that summarize her pioneering findings.

Vital providers in forests are what Prof. Simard calls Mother Trees. They are the oldest, usually largest trees within a forest neighborhood (a stand) that act as centralized hubs. Mother Trees bolster communication and nutrient exchange among other trees. They are the proverbial adhesive that holds a forest stand together. A picture of a temperate forest Mother Tree is shown below. Mother trees carry genes from prior climates and provide sanctuary to many symbiotic creatures, increasing biodiversity.

A temperate rainforest Mother tree, far right.

 According to Prof. Simard and subsequent researchers, this communication occurs not just between the same species, but between different species of trees in the network. Who’d have guessed. Not the commercial timber industry, who was a staunch critic of her research. The industry’s myopic pursuit of single-species “free-to-grow” clear-cutting has devastated healthy forest diversity in British Columbia as well as many other places around the globe.

The Earth’s forested land has been declining for centuries. At the beginning of the 18th century, prior to the Industrial Revolution, forests accounted for 52% of the planet’s habitable land (5.5 billion hectares), 9% was devoted to agriculture (both field crops and grazing land), according to Our World in Data. During the last three (3) centuries human population and the consequent demand for agricultural acreage have grown significantly.

By 2018 just 38% of habitable land is forested, 46% is agricultural (15% cropland, 31% grazing), 1% is urban areas. World population between 1700 and 2018 increased well over 12x, to 7.59 billion people.

The 27% drop in forested land between 1700 to 2018 has been due principally to two (2) inter-related factors; increased population and enlarged agricultural (ag) land use which grew 5x as large. Half of the loss in global forested land has occurred in just the last 100 years. Urbanization has not been as prominent factor in deforestation. Urban land now accounts for 1% of Earth’s habitable land.

Largely, it’s what we eat, not where we live that’s caused forested land to drop. Modern crop technology has allowed ag land to be up to 10x more productive since 1700. In spite of this, millions still go hungry.

Burning rainforests to plant soybeans, such as Brazil has been increasingly doing, has consequences. As we learned in high-school science, trees perform the impressive feat of absorbing carbon dioxide (CO2) from the atmosphere and replenishing it with oxygen. They accomplish this fortuitous environmental miracle by photosynthesis. Trees’ leaves absorb CO2 and water and use the sun’s energy to convert this into chemical compounds such as sugars that feed the tree. Oxygen is produced as an essential by-product and released through their leaves. Tropical and temperate rainforests produce roughly one-quarter of the Earth's oxygen.[2]

Creating preferential protections for Mother-Tree laden old-growth forests is an imperative alternative to the short-term “slash-and-earn” bravado of too many timber companies. Ultimately, humanity requires biodiverse forests full of trees that are healthy and ample enough to provide sufficient oxygen for all of us O2 breathing animals

We need to protect our Mother Trees as a vital part of Mother Earth for many reasons, including this fundamental one.


[1] Glass (Hexactinellid) sponges live in very deep sea-waters in the Antarctic and Northern Pacific oceans. Some scientists guestimate a maximum age of up to 15,000 years for these sponges.

[2] The majority of the Earth’s oxygen, perhaps as much as 75%, is produced from oceanic plankton. Marine plankton are mostly microscopic in size that include bacteria, archaea, algae and protozoa. Kelp forests also create oxygen. 


Sunday, June 20, 2021

IS INFLATION COMING OR GOING?

 To inflate or not to inflate? That is the question. ~ Jerome H. (Hamlet) Powell   

The principal issue in the eccentric world of macroeconomic policy-making focuses on inflation, as my currently-germane alteration of Hamlet’s famous soliloquy states above. Is it rising and staying for a while or is it merely a temporary drive-by event?

Even though a great deal depends on it, no one knows the answer. That’s despite economists’ reviewing decades of data and using their forecasting models day and night. That hasn’t stopped specialists from offering many differing opinions; following the adage, “often wrong, but never in doubt.” Perhaps macroeconomists should add trendspotting algorithms that have become popular in the fashion industry into their models.

For economists, inflation refers to an increase in the overall level of a nation’s prices. More technically, inflation occurs when aggregate prices of consumer goods and services rise due to “excessive” demand or insufficient supply. As prices rise, the purchasing value of money consequently falls.

Aggregate prices is a nebulous macroeconomic concept referring to a measure of prices for all of our nation’s final goods and services– from soap to syringes, and everything in-between, like Buicks, donuts and urologist visits. Our most-often used measure of inflation is the Consumer Price Index (CPI) that is calculated monthly by the Labor Department’s Bureau of Labor Statistics (BLS).

The CPI offers quite a few different “flavors” of prices, like prices for urban consumers, for urban wage earners and for the elderly. The BLS gathers data on consumer prices for each of 211 different categories of consumer items (the “market basket” of goods and services) in 38 different geographical areas throughout the US.

When the BLS released the May CPI information on June 10, the media and others took serious note. During the last 12 months, the CPI increased 5.0%, the largest 12-month increase since August 2008. This annualized increase is over two times as large as the 2% inflation rate that Mr. Powell, Chair of Federal Reserve Bank, hopes to see.

At the Fed’s summer meetings last week, officials stated they would keep interest rates near zero, but explicitly stated they would consider increasing rates, perhaps twice by the end of 2023 if inflation persists. This statement is a direct reaction to the May CPI announcement. 2023 is a year sooner than the Fed has previously stated for considering interest rate changes. The Fed thus has increased inflationary expectations. Unsurprisingly, stock markets took that news poorly, dropping almost one percent and bond yields increased.

The Fed steadfastly maintains that current inflation is “transitory,” never defining what that term means. The last two months have presented higher-than-expected annualized inflation, 4.2% in April, 5.0% in May. If June’s CPI number is 4% or greater. it will be much harder for the Fed to proclaim again it is transitory. We’ll know on July 13.

The Fed’s transitory belief rests on two premises. First, aggregate production will continue to increase steadily as recent parts shortages and supply-chain lags ameliorate, like chip-sets for autos and trucks and lumber for construction. Second, consumers’ demand for goods and services now reflects surging needs that were restricted during the extended covid period; these will taper. Thus, after this temporary phase, markets will get back to “more normal” behavior with more goods and services available and less pent-up demand.

Most importantly, policy-makers need to adopt a more farsighted view of our economic activities, which is vital for producing well-founded economic programs. Monthly CPI data are interesting and instructive, just as weekly unemployment claims requests are. But these very short-term data are inherently quite variable. Their use should not be overemphasized, as they seemed to have become. Most economists are far better at drilling down for detailed information than we are at looking up. Adopting a broader, longer-term perspective will produce stronger, fairer policies.

The media have filled screens, airwaves and newsprint with stories about how May’s unexpectedly large CPI reflected price increases in specific slices of the economy. A Washington Post story mentioned consumers are paying more for an array of products, including bacon and used Buicks, as the economy rebounds strongly from the brief covid-led recession.

Several items whose prices have notably risen include used cars (Buicks and beyond), furniture, gasoline, washing machines and dryers, bicycles, lumber and airfare. Beef and non-Congressional pork prices have also risen.

But not to worry spending-fans. In January, House Dems after a decade-long ban, resurrected personal earmarked projects. These “pork” projects can be specifically-funded by a single Congressperson that circumvent the standard merit-based and competitive allocation process. How can you be upset at this change? There’s a $1.4 trillion per year limit for such projects. The Dems insist these pork-rind earmarks will provide lawmakers new tools to better serve their communities, and bring home the higher-priced bacon. Praise be? Not.

Back to Buicks. The mention of old Buicks immediately recalled my grandfather’s, which looked much like the one shown below. When we visited, he drove us in his sweet midnight-black, side-portholed Buick on fine Sunday rides through Western Massachusetts countryside. They don’t build them like that anymore.


 1951 Buick Special sedan

A 1951 Buick Special cost $1,800, which in today’s dollars is $18,637. The 2021 Buick Encore, the lowest-priced model like the Special, costs $26,260. That’s fair amount of auto inflation, to the tune of $7,623 more than the CPI-adjusted Special price. This 41% premium accounts in part for the vast increases in Buicks’ automotive quality and technical improvements gained by GM over the past 70 years.

Our inflation rates have steadily fallen during the last 50 years, as shown in this table. The average

Decade

Average Yearly Inflation Rate

1971-80

7.86%

1981-90

4.74%

1991-2000

2.81%

2001-10

2.38%

2011-20

1.73%

Source: DOL/BLS

 yearly inflation rate during the 1970s was 7.86%. Two international oil crises and subsequent stagflation in the late 1970s – early 1980s caused its loftiness. Stagflation is a truly nasty, worst-of-both-worlds combination of high inflation juxtaposed with elevated unemployment. In January 1981, the interest rate set by the Fed, the Federal Funds Rate (FFR), as a basis for monetary policy was 19.08%, together with 7.5% unemployment and 10.3% inflation. Terrible times for everyone.

After 1982, US annual inflation has never been greater than 5.4%. Thus, any American younger than 40 years old would think high inflation was more than 5%, at worst. Long gone are the nasty macroeconomic mid-1970s and early 1980s, when inflation never got below 5.7%.

The most recent decade’s average inflation rate was 1.73%, thankfully less than one-quarter the 1970s level. The FFR currently remains a rock-bottom 0.06%, unemployment has been steadily dropping since April 2020, now is 5.8%.

Although people remain concerned about inflation, US price increases are far smaller than a several other countries. Venezuela’s citizens have faced the world’s worst inflation for years due to massive government malfeasance. Last years’ inflation in Venezuela was a gigantic 9,568%, down from a stratospheric 1,698,488% in 2018. Venezuela’s cumulative inflation from 2016 to early 2019 was estimated at 53,798,500%. This unfathomable inflation is the reason Venezuela’s official minimum monthly wage is currently worth only $3.20. Zimbabwe, always high in international rankings, has the second-topmost inflation at 767%. Such giant hyperinflation rates are usually caused by the government’s oversized increase in the money supply that cannot be warranted by (absent) economic growth.

Meanwhile back in Washington, Dems in Congress continue wrestling with how to fund the administration’s expansive infrastructure programs. Fearing that their more moderate colleagues’ nascent, bipartisan $1 trillion (T) effort will ignore many of their priorities, progressive Dems’ latest idea is to combine all their sprawling hopes into one single, giant effort, perhaps as large as $6T – a wish-list including most Prog favorites. The combined $7T possible infrastructure spending would represent 33% of our current GDP. No matter how worthy such outlays might be, they would likely unleash intimidating inflationary pressures.

Each of these bills face formidable odds of passing in no small part because they will require every Senate Dem to vote for them. Approving a single, $6T bill for widely-demarcated infrastructure will push way beyond Senate prospects. One other hindrance is Congress’ feeble work schedule. House members plan to toil in Washington only 9 days between now and Labor Day; Senators just 16 days. The House will not be in session at any time in August. Legislative life on Capitol Hill is indeed very different from other workplaces. Does such a schedule justify why we taxpayers provide these “legislators” with a perhaps-inflated $174,000 salary?


Wednesday, June 2, 2021

TRANSPORTATION AND TRANSFORMATION

Education is all a matter of building bridges. ~ Ralph Ellison 

President Joe Biden and his administration have been discussing their vast infrastructure plan with many people for nearly two months. His $2.3 trillion (T) American Jobs Plan (Plan) will influence and change countless aspects of Americans’ lives during the eight years of planned expenditures. It’s all infrastructure; whether we’re talking about roads, lead pipes, child care, community college or high-speed internet, right? Nope, my infrastructure isn’t necessarily yours. Unsurprisingly, the Repubs and Dems have quite different definitions of “infrastructure.” 

I focus here on two key, oddly-related facets of infrastructure, US roadways and higher education – transportation and transformation. For a long time, attending post-high school educational institutions, and importantly graduating with a degree-in-hand, has been considered the central roadway for transformed career success. These two areas are important parts of the Plan. 

The bipartisan discussions about his Plan paused last week with the Repubs going low, offering a $928 billion (B) package that the Dems argue only represents a slender $32B more than their last suggestion – an unworthy pittance in their budgetary judgment. Progressive Dems, going super-lofty, want the Plan to be more than 4x bigger than it already is. Neither will happen. 

The dispute focuses on what infrastructure is and isn’t. The Dems’ vision of infrastructure is much broader and bigger than the Repubs’. For the Dems, a BA or AA degree, or a pre-school class, is another kind of bridge; like Ralph Ellison states above. Not so, say the Repubs; stick to concrete and asphalt. 

Evermore Dems now want Captain Biden to abandon the sinking bipartisanship effort and push his Plan through the Senate via the convoluted, but hopeful one yes-vote margin reconciliation process. No matter what strategy President Biden ultimately decides on, his Plan’s ideas for transportation and transformation merit consideration. 

Transportation.  The President’s Plan would spend $621B on transportation infrastructure. This includes improving at least 20,000 miles of roads and 10,000+ bridges, plus a great deal more. 

The federal government first got involved in large-scale highway transportation when President Eisenhower signed the Federal Aid Highway Act of 1956 (Act) which created the Interstate system. We will celebrate its 65th anniversary on June 26. 

Interstate highways now cover 46,876 miles throughout our nation. The official title of the “controlled-access expressways” built via this Act is the Interstate and Defense Highways. Defense was one justification for federal funding. Thank goodness eight-wheeled, 20-ton Stryker ICVs (Infantry Carrier Vehicles) have the authority to motor on the I-15 as they head towards Area 51. 

California has the most Interstate miles, 4,257. Washington, D.C. the least, 12 miles. The state with the smallest Interstate mileage is Delaware, where our gear-head, car-guy president could drive his sweet 1967 Stingray ‘Vette over each of Delaware’s 41 Interstate miles in far less than an hour.  Go Joe. 

The 1956 Act specified the expressways would all be built in 10 years; it took a bit longer, 62 years. Now these highways, as well as many state and local roads are in need of considerable maintenance and refurbishment, as shown below. 


    Fractured Freeway 

There are many more types of transportation infrastructure than roads and highways. The Department of Transportation (DOT) provides funding for virtually all of them. 

But not interstellar travel via UAPs – Unidentified Arial Phenomenon – which is governmentese for what the rest of us know as UFOs. Fortunately, President Biden’s national intelligence director will soon release a report to Congress describing what our government allegedly understands about UAPs. Get ready Mulder and Scully, here we come, again. 

But back to Earth-based transportation. The DOT has allocated about 66% of its budget for highways, 20% transit and rail and 13% for aviation. The Biden Infrastructure Plan would invest $115B to refurbish “most-in-need” roads and bridges and $20B to improve road safety. The Plan also proposes spending $174B on electric vehicle (EV) infrastructure, including erecting a nation-wide network of 500,000 EV charging stations as well as replacing the government’s diesel transit vehicles with EVs and continuing EV tax incentives and rebates. Airports would be improved with $25B worth of funding, as would ports and waterways with $17B. 

The Plan likely emphasizes public transit, which makes particular sense in densely-populated areas. Unfortunately, transit historically is what economists label an “inferior good,” meaning as a person’s income rises, she/he uses less of it. “Normal goods’” demand increases as income rises, not transit. How the administration can surmount this long-established challenge for transit is left unresolved. The administration can increase its funding of transit, but convincing more real people to ride it is another matter. This issue echoes Sen. Daniel Moynihan’s insight: government programs are far more successful in creating jobs than in changing the way people behave. 

When it’s enacted, the president’s infrastructure plans will have a colossal impact on the nation and the DOT. I’m concerned how the DOT will rapidly increase its staff capabilities to properly implement and manage all the additional spending. The administration’s proposed 2021-22 budget for the DOT– $88B – is $1B less than it was for the current fiscal year. Huh? My concern equally applies to every other federal, state and local agency that will be responsible for large-scale, federal infrastructure funds; like the Department of Education (ED), discussed below. 

There will likely be a (sizeable) supplemental budget request. In the absence of the agencies buying hundreds of trained Adminbots, my bet is consulting firms that are prominent players as “DC Beltway Bandits” will assume a decent share of these vital, extra tasks. I’m not holding my breath, but hope the Bandits scrupulously attend to the public’s interests in their efforts. 

Education.  The president’s program will include substantial education funding, from pre-school through college. I focus here on the administration’s proposed higher education efforts. 

Higher education has been a principal thoroughfare for personal as well as national growth during the past 50+ years. College enrollment dramatically increased as my Boomer generation started attending and graduating from college in the 1960s. Undergraduate college enrollment rose every year for over 60 years and peaked in 2010; it has risen 26.9% since 2000. 

The president’s infrastructure program includes nearly $300B for college-related actions. Last fall about 16.7M undergraduate students were enrolled in the nation’s four-thousand “degree-granting postsecondary institutions” (aka, colleges and universities). During the current spring semester, enrollment dropped 5.9% compared to last year, due to the pandemic. This decline has upended students’ as well as college faculty’s and administrators’ lives. 

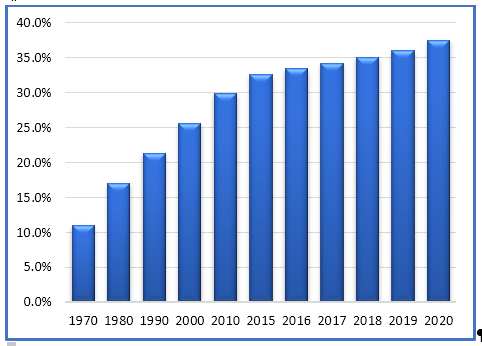
Nevertheless in 2020, 37.5% of US adults (25-64 years old) had received at least a BA degree, an all-time high during the last 50 years, shown in the chart below. This is a stunning set of individual achievements, which has transported the nation onwards. 

Percent of US adults with a BA or higher degree, 1970-2020 

Source: NCES 

President Biden’s educational infrastructure program aims to make all 853 public two-year colleges tuition-free with $109B of funding; 17 states already have zero-tuition community colleges. Another $80B will augment that provided for Pell Grants, and $62B for “retention and completion” (aka, remedial) programs. Separately, $39B will be offered to Historically Black Colleges and Universities (HBCUs) and Tribal Colleges and Universities (TCUs) to cover two years of tuition. 

Two-year community colleges enroll 28.5% of all people attending college; HBCUs enroll 1.1% and TCUs 0.1%. These funds will certainly assist these schools’ current and anticipated students. 

The Pell Grant program was initiated in the 1973-74 school year and named after Sen. Claiborne Pell, who was the chief sponsor. They are grants not loans, thus do not need to be paid back. The president’s proposed addition to the program, which provides needs-based financial support to students (currently capped at $6,195) from lower-income households, represents an enormous 164% increase in Pell Grant funding from 2020. 

This is but one facet of the ED’s proposed, vastly-expanded scope; a giant 41% increase compared to the department’s pre-pandemic budget. 

How the ED and schools will be able to accommodate the expected post-pandemic increased demand in college enrollment unfortunately has not been addressed. It needs to be before these programs are funded, or else there will be large numbers of unhappy students. Why? Because more classes will be unavailable due to excess demand, unless the schools’ available faculty/staff and physical capacity also expand. 

The prospects for transformative benefits coming from more educated men and women are great, if the expanded funds are well overseen. Onward into a smoother-surfaced, better-skilled world where we can all benefit. 


Friday, May 21, 2021

FLYWHEELS TO SUCCESS

 Habit is the enormous flywheel of society. ~ William James

Flywheels have been used for thousands of years. You may not have noticed them because they’re mostly hidden. Nevertheless, they’ve come a long way despite being unacknowledged yet essential parts inside millions of everyday machines.

The word “flywheel” originally appeared in 1784, during the beginnings of the Industrial Revolution, referring to “a heavy-rimmed revolving wheel to regulate motion.” In most cases, flywheels transform intermittent reciprocating motion (for example from a motor’s cylinders) into constant, rotary motion.

The first machine to use a flywheel was a potter’s wheel. The potter’s wheel arguably has been called humanity’s most significant machine invention, second only perhaps to the lever. Some archeologists believe it was invented in Mesopotamia very long ago. Others have said it was first used in China, South Asia, southeastern Europe and/or Egypt very long ago. It’s no surprise that its origin isn’t distinct, ancient potters were making earthenware plates, urns, vases and pots everywhere, even over four millennia ago.

During the reign of Egyptian Pharaoh Sneferu, around 2600 BCE, potters lengthened the turntable shaft and added a separated flywheel directly underneath the wheel. It was a momentous improvement. The flywheel was moved by the potter pulling the edge with the left hand while forming the clay on the wheel with the right (potters apparently were all right-handed way back then). This led to the counterclockwise motion for the potter's wheel rotation, which after 4,600 years still remains almost universal. The successful addition of the flywheel not only changed the way potters made their wares, it significantly increased their quantity and quality. The lowly flywheel thus has contributed to why archeologists can find so much primordial earthenware pottery around the globe.

Later, the wheel’s shaft was elongated again, allowing the flywheel to be nearer the floor so the potter could turn it with a foot, as shown below. This allowed her/him to continuously use both hands to shape the item. What a concept, that again improved productivity and value.


Flywheels have fruitfully spun far beyond potters’ workplaces. They now make mechanical presses, torpedo propellers, mine locomotives, power hammers, riveting machines and research tokamaks actually work. Every one of the roughly 1.4 billion (B) fossil-fuel powered vehicles in the world has a flywheel, along with countless other devices that use reciprocating engines.

Speaking of which, here’s a picture of the pioneering British rail locomotive developed by Richard Trevithick in 1802. Its gigantic flywheel, about 13ft in diameter, evenly distributed the periodic power of its single-cylinder steam engine.

In a modern incarnation of the flywheel, Jeff Bezos, who is once again the world’s richest person, created a company largely founded on what he termed the “flywheel effect.” Amazon’s flywheel has no physicality or relationship to antique potter’s wheels; it’s a self-supporting growth strategy. Other companies have used similar approaches, none as successfully as Amazon.

From its beginning the Amazon flywheel meant providing focused investment in making its customer experience distinctive, worthwhile and valued, so customers would return. In 1994 Bezos founded Amazon as an online seller of books. By 1997, during the dot-com bubble and its successful IPO, the firm was selling more items, including music and videos. The Amazon IPO share price was $18, which if you were then clever enough to buy $100 of them, would now be worth $120,000. Congratulations.

At this point, it’s hard to think of what Amazon doesn’t sell. When customers repeatedly returned to amazon.com it drove Amazon to broaden and improve the selection of goods on the website, which further enhanced its cost structure, due to the benefits of network effects. This, in turn, allowed Amazon to reduce its prices, further spinning the flywheel.

Like the giant flywheel attached to the steam locomotive, it took Bezos and his talented team a lot of effort at first to get it moving. But once momentum picked up, their flywheel allowed them to let things unfold with less exertion and more focus on new opportunities. In 2019, Amazon acquired its 100th company. It currently is negotiating to buy MGM for $9B. Amazon’s flywheel continues turning ever more rapidly and has shown itself to be far, far larger than the Trevithick locomotive’s.

Flywheels thus are worthy of a bit more attention. Going whole flywheel, H.L. Mencken said, “The universe is a gigantic flywheel and humanity is a fly taking a dizzy ride on it.” Ride on.


Tuesday, May 11, 2021

HERD IMMUNITY?

Vaccination is the medical sacrament corresponding to baptism. Whether it is or it is not more efficacious, I do not know. ~ Samuel Butler  

Emus no longer fly higher than we humans’ realistic hopes for attaining global herd immunity from the SARS-CoV-2 virus.

Herd immunity refers to the level of protection from an infectious disease – like covid-19 – that occurs either when a sufficiently high proportion of a human population can no longer acquire or transmit infection, or when immunity resulting through vaccination or previous infection has been attained. Reaching this threshold level of protection is crucial.

Emus, a herd of which is shown below cavorting in their native Australian outback, do not fly. However, they can run as fast as 30mph. But, being appropriately adaptable on six different occasions during their 10-million year stay here on Mother Earth, emus apparently have to been able to fly, then abandoned flight and later relearned how to use their wings for liftoff. Impressivo. Do emus enjoy herd emunity? That is not yet known. 

A herd of emus in the outback. With herd emunity?

In early 2020, at the height of initial pandemic anxieties, the CDC and other public health authorities proclaimed herd immunity as a goal for its efforts to curtail the spread of SARS-CoV-2, aka covid-19. Early on, when asked about covid herd immunity, the CDC said it was possible after about 60-70% of all of us are immunized and behaving appropriately.

Through last spring and fall, the CDC emphasized attaining herd immunity. It no longer does. This puzzling change acknowledges a shift in epidemiological thinking. Several intervening factors likely make attaining herd immunity an uncertain prospect at best, and realistically unlikely any time soon.

These factors include: the uneven vaccine rollout, together with some people’s persistent, “unscientific” hesitancy about getting inoculated with a vaccine and widely-circulating coronavirus variants, like B.1.1.7 here in the US.

Such covid variants have been completely expected. It’s what viruses do. Unfortunately, every virus does its best to lengthen its effective life-cycle by always producing mutant variants (also called strains). Some strains are more contagious and/or lethal, others are not.

The annual flu vaccine “booster shots” that we’ve been living with since 1945 attest to such variants. Each year’s booster shot for flu is different, depending on the latest variants. Despite the shots, on average the flu kills 36,000 people in the US per year.

According to the FDA, the 2020-21 seasonal influenza vaccine formulation will likely cover four viral variants: an A/Hawaii/70/2019 (H1N1) pdm09-like virus; an A/HongKong/45/2019 (H3N2)-like virus; a B/Washington/02/2019-like virus and a B/Phuket/3073/2013-like virus (B/Yamagata lineage).

So now you know and can ready your arm for flu shots beginning in October. Interestingly, last year’s flu season was unusual in that flu cases began to decline in March. According to the CDC, this was “perhaps associated with community prevention measures for covid-19.” Thank goodness for small favors.

But back to our current nemesis, covid-19. Contrary to the media’s hype – the multitude of misbegotten headlines about “conquering covid” – after the first covid vaccines became available last December, the covid-19 virus will not be defeated any more than the typical flu virus has been.

There won’t be a “one and done” covid vaccine. The covid-19 virus will very likely need to be “managed,” like every other dangerous virus has been for over 200 years. Depending on how long immunity lasts, each of us should expect to receive periodic (possibly annual) covid-variant-based booster shots.

On May 3, Dr. Anthony Fauci himself dismissed the relevance of herd immunity as a goal, saying “People were getting confused and thinking you’re never going to get the infections down until you reach this mystical level of herd immunity, whatever that number is.” Mystical; that’s nice word-play Dr. Merlin.

On May 10, Jeffrey Zients, the White House Covid Coordinator, stated instead of reaching herd immunity, the goal should be to achieve some sense of normalcy by getting 70% of Americans immunized. Ah, normalcy. But does it beat herd immunity? More to the point, what exactly does “normalcy” mean?

Dr. Fauci and Mr. Zients are casting mistargeted aspersions. We vaccine-recipients and non-recipients ourselves were not “getting confused.” We are being excessively aided in our confusion by experts like yourselves who have been broadcasting differing, inconsistent stories about covid’s apparently-mystical herd immunity, and its threshold level. If anyone is confused, it’s been the experts. Not us.

Some doctors have said the covid herd immunity threshold (HIT) rate – the immunization level required to provide general, overall population protection – is about 60-70%, as mentioned above. Other epidemiologists have estimated the covid HIT rate is more likely 80-90%.

After months of emphasizing it, experts like Dr. Fauci are now shelving herd immunity as a goal for covid control. My bet is they’re now dismissing herd immunity because it cannot be realistically attained. Reaching herd immunity across Earth’s seven continents is even more next to impossible.

If we can somehow now become convinced to forget about herd immunity and instead believe in attaining “normalcy,” public health experts and administrators could eventually be judged victorious.

For other infectious diseases, attaining their HIT rate has been successfully accomplished. Measles’ HIT rate is an unmystical, but high 95% due to its significant contagiousness. Like other transmissible diseases, measles has been around for a long time. The measles virus moved from livestock to humans roughly 4000 years ago. A vaccine was introduced 58 years ago, in 1963. This vaccine remains 99% effective.

The measles, mumps, rubella (MMR) vaccine is administered to young children, as you may know or even remember. The CDC has declared 90.8% of US children by age 24 months have been immunized for MMR. In 2019, there were just 1,282 individual cases of measles throughout the US. Victory! Nevertheless, about 1.3M people die from measles annually across the globe.

Since Jan. 1, 2021, 3.2M deaths have occurred worldwide from covid; just over 581,000 in the US. As of May 11, 35% of Americans are fully vaccinated.

No matter how mystical it might be, public health authorities should continue wrangling to reach herd immunity for the covid-19 virus, not just whatever normalcy may be. They possess vital medical and social obligations to do so. Attaining the final percentages of immunization for the US covid HIT rate will be challenging and involve disproportionate expense and time. Is that extra expense worth it? Folks including the president will have to decide when to declare relative “success,” but it isn’t going to be soon.