Thursday, June 23, 2022

A TALE OF TWO elastiCITIES

It was the best of times, the worst of times. ~ Charles Dickens  

Charles Dickens wrote A Tale of Two Cities in 1859 in the later part of his literary career. Dickens was already an admired, well-known author when wrote this book. I read A Tale of Two Cities long ago, together with many other high school-age Boomers. So long ago I hardly remember the book’s plot and characters. Nevertheless, the book still has relevance. 

Dickens’ judgements of Victorian society were represented in his tale. He sympathized with the revolution’s overthrow of France’s imperious aristocracy but disparaged the subsequent reign of terror. Fortunately today we have no broad reign of terror, except perhaps in the divergent eyes of radical leftists and rightists. Views of our aristocracy are similarly conflicted depending on which side of the political spectrum one inhabits.

No matter what your political beliefs are, our continuing excessive inflation has effectively emptied many people’s pockets. Inflation-adjusted weekly earnings for employees decreased 3.9% during the year ending in May. Investors have suffered more; the stock market is now in bear territory. The S&P 500 has dropped 13.3% during the past 12 months and 30.5% since Jan. 3. Pop goes the market.

 

A grizzly bear alarming intrepid investors.

Explaining who and/or what is responsible for our growing macroeconomic predicament is a challenge. President Biden’s attempts to blame Czar (er, Russian President) Vladimir Putin are valid, but not the whole story.

Anyone younger than 40 years old has never lived with inflation as high as it now is at 8.6%[1]. The average yearly inflation rate during the Millennial generation – the oldest of whom are now 41 years – was 4.1%. For Gen Zers –  the oldest are now 25 years – the average inflation rate was 2.4%. Although both these averages are greater than the Fed’s 2% target inflation rate that was officially set a decade ago, they are much lower than today’s inflation rate.

In 1981 we suffered from 10.3% inflation, principally due to the after-effects of the Iranian Revolution and resulting world Oil Shock, too-robust government spending and a swirling wage-price spiral. The Federal Funds Rate (FFR), our key baseline interest rate that the Federal Reserve sets, was 21% in 1981, which is more than 10x higher than the current FFR.

Starting in the early 1980s, this four-decade long period of historically low inflation has both been truly remarkable and uncommon. It has now ended.

Once again, dramatic energy price rises, initiated last month when the 27 European Union nations proclaimed they will be cutting much of their petroleum and natural gas from Russia, have enlarged macroeconomic inflationary pressures facing us consumers, shown in the table below. The giant increases in energy prices are notable. By themselves, gasoline prices have increased an astronomical 48.7%. The price of any kind of vehicle has also risen dramatically.

Consumer Price Index for All Urban Customers (CPI-U)

Annual Price Increase ending May 2022

All Items

8.6%

Food at Home

11.9%

Energy (incl. gasoline, electricity & natural gas)

34.6%

New Vehicles

12.6%

Used Cars & Trucks

16.2%

   The US government’s $5 trillion of covid-induced stimulus checks, business support and funding to state and local governments have increased consumer demand for many goods and services that have been stymied by supply-chain snafus.[2] When overall consumer demand increases relative to available supply, inflation results. Despite being clearly needed and useful, there’s little doubt such government funding has contributed to the economy’s inflationary pressures.

Elasticity is one analysis tool that microeconomists use to judge how much customer demand changes as a consequence of a good’s price changes. If a relatively small percentage increase in a good’s price causes consumers to buy disproportionately much less of that good, its price elasticity of demand (PED) is said to be elastic; numerically the elasticity is greater than 1.0. Conversely, if a good’s price increases by a relatively large percentage but consumers’ demand doesn’t change much, this good’s PED is said to be inelastic, and less than 1.0.

Factors that influence a good’s PED include whether it is a necessity or a luxury; whether it has close substitutes; what proportion of a person’s income is spent on this good; and how much time has passed since the price changed. If a good has no close substitutes, doesn’t account for a large proportion of people’s expenditures and the price change has been recent, then that good’s price elasticity is likely to be numerically low, termed inelastic. A good that has price inelastic demand is not that sensitive to price changes.

Let me tell a tale of two goods’ elasticities that have particular relevance for our existing situation: gasoline and food.

Gasoline’s PED is quite inelastic; calculated to be -0.26, which means if the price of gasoline increases 10%, consumers’ demand for gasoline will decline 2.6%, much less than the price increase. This calculation is unsurprising given that until very recently there have been no substitutes at all for gasoline if you drive a car. Gasoline remains an absolute necessity for the 97% of us car-owners who don’t drive EVs. As I mentioned above, gasoline prices have risen nearly 50% since May 2021, which means that car drivers’ demand for gasoline could drop by only 13%, given its PED. One of several conflicting factors that could lessen this drop includes that it’s now officially summer vacation time when folks who’ve been cooped up for months due to covid want to travel “on the road.”

Gasoline demand’s very low price elasticity also means that President Biden’s request to temporarily eliminate the 18.3¢/gal. federal gas tax won’t have much if any effect. His proposed 3-month gas tax holiday will likely have about as much impact on the US gasoline market as his release of millions of gallons of oil from the Strategic Oil Reserve did several months ago; which is to say minimal. But these actions demonstrate Joe’s at least trying to reduce inflation; perhaps more than his previous, bizarre statement that his bipartisan infrastructure program will diminish inflation. Don’t hold your breath, infrastructure expenditures’ effects move at the tortoise-like speed of concrete.

A gas tax holiday is a strictly performative, smoke and mirrors action that would effect no significant inflationary relief. In addition, it will cut the already-stretched Highway Trust Fund of needed infrastructure money. I expect the impact of a transitory removal of the federal gas will mostly be visual, showing a small price reduction on the giant price signs at gas stations across the nation.[3]

This is especially true if you live in California, as I do. On July 1st, our state’s gas tax, which has a built-in yearly CPI adjustment, will increase to a monumental 53.9¢/gal., the highest in the US. My closest gas station is currently selling regular at $6.39/gal. If only it were a mere $5/gal. like the media constantly reminds everyone.

It’s fortunate that Congress will unlikely go along with the president’s proposed tax holiday, for political not substantive reasons. But if enacted, I and the other 39 million Golden Staters would see only a 2.8% reduction in our gas price that could result in a miniscule 0.8% increase in the demand for gasoline given its inelastic PED. Even this slender price break has been understandably and vociferously opposed by environmentalists and most economists as the wrong way to “get to green,” despite its ephemeral value for the inflation-fighting president. In sum, due to gasoline’s price inelastic demand Joe should not press Congress to add another federal holiday.

Let’s now examine a second good’s price elasticity of demand. Food is in an elite class of items because it is absolutely required by all living creatures to sustain life, like air and water for those of us who live on more or less solid ground. As a necessity, food’s PED is quite inelastic, meaning the amount of food we consume is not much influenced by price changes. And as you’ve already noticed, food prices have risen. The price of food we buy for home consumption at grocery stores has increased 12% during the past year.

There are many different kinds of food, as anyone who walks the isles of a grocery knows. The average grocery store apparently carries an astonishing 40,00 individual items, which means there’s not just a single price elasticity for food. Price elasticities are calculated for specific food types.

Fortunately, thoughtful microeconomists have been busy for decades estimating the price elasticity of demand for many food types. One meta-assessment of food type elasticities reviewed 160 individual studies. Soft drinks, the most-often purchased item in groceries, have an inelastic PED of -0.79. The food item with the greatest price inelasticity (the numerically lowest numeric value) is eggs at -0.27. The PED of milk, the second most purchased food item, is a bit less inelastic than eggs at -0.59; meaning a 10% milk price increase could reduce milk purchases by 5.9%. Our grocery store offers a stultifying choice between 37 different types of “milk:” everything from 7 versions of good ol’ animal milk (in 4 different fat concentrations: whole, 2%, 1% or 0%) and 2 different sources (cows and goats) to 30 versions of plant-based milks (almond, coconut, oat and soy).

This tale of two inelastic elasticities - food and gasoline - has illustrated the president’s weak and limited policy options to reduce inflationary pressures. However, these elasticities have far less direct consequence for the Federal Reserve’s efforts to cut inflation. That’s because Fed anti-inflation policy focuses more narrowly on increasing the price of money (hiking loans’ interest rates) to reduce aggregate demand.

Last week the Fed finally increased the Federal Funds Rate by a whopping three-quarters of a percentage point to 1.75%, the biggest hike since 1994. This increase will raise the cost of consumer and business loans that the Fed hopes will eventually reduce demand for big-ticket items like appliances, cars, homes and business expansions. The Fed’s action, along with its sale of some of the $8.5 trillion corporate bonds it has amassed, will reduce or tighten the US money supply. The risks associated with the Fed’s delayed, aggressive tightening our money supply include eventually pushing the nation into a recession, with higher unemployment and reduced GDP growth.

The Fed chairperson Jerome Powell and his 20,000 employees remain cautiously optimistic that its efforts will reduce inflation to its 2% target without causing a hard-landing recessionary downturn. The Fed’s record in this arena is problematic.

Since 1955 during 7 previous inflationary cycles when the Fed has increased the FFR as fast as it’s now doing, a recession has followed in 6 of them. Six out of 7 means the Fed’s Recessionary Batting Average (RBA) is regrettably an economic Hall of Fame high of .857. Looking even farther in the past, the Fed has managed to reduce inflation without wounding growth only 3 times since 1945.

Will 2022-23 demonstrate a rare, successful economic soft landing for the Fed’s anti-inflation efforts that reduce its all-too high RBA? We can help by embracing the Fed’s efforts by somehow believing in an edited version of Dickens famous book’s incipit, “it is an age of wisdom and a season of light.” The benefits of such an embrace can go far beyond softly taming inflation.


[1] As measured by the Consumer Price Index for all urban consumers (CPI-U).

[2] Snafu is an acronym that stands for situation normal, all fucked up. It was born in the beginning of WWII by Marines as a satirical expression of what they all too often faced on a day to day basis.

[3] Interestingly, these ubiquitous signs are not required by federal or state regulation. Nope, it’s drivers like you and me who in effect require those signs, born from decades of tradition that gas station operators accede to. 


Monday, May 23, 2022

WATER and WHEELS

You can lead a horse to water, but a pencil must be lead. ~ Stan Laurel 

There’s now next to no water available in much of the western US, especially California. Little water is sluicing down rivers to help salmon spawn and produce dams’ clean hydroelectricity, or sloshing along irrigation canals that create a bounty of produce, or providing liquid sustenance to millions of parched customers throughout the region. We again face a serious lack of water.

The supply of electric vehicles (EVs) has shrunk because of supply-side snafus. More folks are thinking of purchasing an EV, largely due to huge increases in gasoline prices – in Berkeley, gas prices well above $6/gal. are common. But far more substantial EV purchases are needed, along with greater numbers of public charging stations.

Thus, water and EV wheels each have problematic challenges at this point. Water wheels are barely turning despite politicians’ grandiose pledges.


Let’s first look at water before shifting to wheels.  California’s 39 million inhabitants depend on sufficient, clean water for their daily livelihoods, just like everyone does no matter where they live. But as Marc Reisner presciently stated 36 years ago in his landmark Cadillac Desert, much of California is a semidesert. Climatologists have shown that periodic droughts in California and the West are a long-time, recurring feature. Residents of the Golden State (perhaps better labelled now the burnt brown state) are in the midst of a multi-year regional drought that may be the worst in 1200 years. Other notable droughts include the 5-year event in 2012-2016, as well as in 2007-09, 1987-92 and 1976-77. “Dust bowl” dry conditions have periodically harmed Californians, just like they did for more than a decade in the 1920s and 1930s for folks in Oklahoma. Despite all these droughts and history, we haven’t yet fully understood that fresh water in the Western US is a finite resource that’s traditionally been priced way below its value, especially for non-residential customers.

The bulk of the state’s precipitation falls in the Sierra Nevada as winter snow and rain hundreds of miles from the nearest population centers. Seventy-five percent (75%) of California’s supply of water is in the northern third of the state roughly north of Sacramento, but 80% of urban and agricultural (ag) demands are in the southern two-thirds of the state.

Because of this geographic misalignment of water supply and demand, during the past 90 years the federal government and the state of California have constructed a huge system of water infrastructure including dams and aqueducts/canals to bring water from distant mountains and rivers to farm acreage and masses of urban end-users, businesses and individuals like you and me.

How is our state’s precious water used? Nine million acres of California farmland is irrigated, which represents about 77% of the state’s total end-user water demand. Agriculture is by far the single largest user of California water. In the proverbial average year, agriculture uses 4x as much water as urban end-users.

The abundance of California’s ag production is the most valuable of any state, everything from artichokes and almonds to garlic and walnuts. However, our enormous ag harvests paradoxically account only for a slender 1.5% of California’s gross state product. A gallon of water doesn’t offer much fiscal bang per bushel of California produce.

Unlike most previous droughts, both state and federal water authorities – the California State Water Board and the Bureau of Reclamation, respectively – already have significantly curtailed their water allocations to ag and other end-users. In March, the State Water Board slashed its water allocation from the State Water Project (SWP) to just 5% of normal for the SWP’s ag and urban customers.

In April, the federal California Water Project cut its water allocation to irrigation contractors to 0% of normal. For the second consecutive year ag irrigators supplied by the CWP will receive no federal water. Farmers will need to turn to groundwater or storage, if they have it, or else forgo planting and production entirely. The Central Valley’s land subsidence will intensify. If this drought continues as expected, California growers and our land will suffer greatly, and the prices of their food products will swell.

The East Bay Municipal Utility District (EBMUD) supplies our home’s water, along with another 1.4 million customers. Last month, EBMUD reported its Mokelumne River storage reservoir was 71% full which is less than normal for this time of the water-year, but fortunately much fuller than either the California state or federal systems’ reservoirs that are now hovering around being 25-30% full.

Like many other water distributors, EBMUD has recently mandated an immediate usage reduction by its customers: a district-wide 10% water use decrease together with an 8% price “surcharge” beginning on July 1. In addition, EBMUD instituted restrictions on outdoor water use and a sizable “excessive use penalty” for households who use more than 1,636 gpd (gallons per day). No worries there; our usage is less than 13% of that large threshold. We’ve cut back on our landscape watering. Landscape watering accounts for roughly 50% of homeowners’ typical usage, so that’s a fine place to start despite gardeners’ understandable lamentations.

“Nonfunctional” grass lawns are becoming so yesterday. Significant sod is being removed in desert-dry Las Vegas where such lawns have been outlawed and made illegal to water. Here’s hoping such water conservation efforts by a so far reluctant public water-users can soon make a sizeable difference. Otherwise, every Californian will learn how they must use even less water than they have been.

Let’s now turn to electrically-powered wheels.  A substantial part of US environmental improvement policy rests on significantly increased sales of EVs. In 2021, EVs accounted for 3.3% of total US car sales. Meaning there’s lots of room in the vehicle market for EVs to capture, if people decide to buy them and shed their generations-old routine of purchasing fossil-fueled vehicles.

As you have already noticed, inflation has spread its ugly, non-transitory budget-sapping cloak across many markets. As a result, macroeconomists have been uttering a word, that hasn’t been spoken in 40 years, stagflation. Stagflation is the nasty, simultaneous combination of economic stagnation (diminished macro growth) together with inflation (elevated general price increases). Stagflation may be in our future; inflation is here already.

Giant upsurges in the price of gasoline – 43.6% over the past year – have spurred more people to consider EVs. But EVs’ availability has been constrained by the lack of key components needed by manufacturers. The increased interest in EVs together with their limited supply has driven too many dealers to add substantial markups on their EV prices that were already higher than gas-fueled cars. Customers have complained these markups can sometimes add thousands of dollars to an EV’s MSRP. One industry publication states that some EVs’ prices have jumped 25% in the last year, and wait-times have lengthened. If they persist, such grumbles will confound attainment of the ambitiously-set EV market advancement.

President Biden has addressed several federal efforts to increase EVs. First, he signed his Infrastructure bill into action last November. This $1.2 trillion legislation will eventually provide $7.5 billion over 10 years to expand the nation’s meager EV charging station network. In addition, Mr. Biden signed an Executive Order last August calling for the federal government to ensure that 50% of all vehicles sold in the US will be electric by 2030. This Order was a political statement, not an actual plan because it included no funding to accomplish the aggressive objective. The Build Back Better (BBB) plan would have provided needed funding. But he and the Dems struck out with his vaunted, much larger BBB that remains a fading disappointment. It never was voted on in the Senate after passing the House. Among other efforts, it would have nearly doubled the federal EV purchase subsidy to $12,500 if the vehicle was made in a factory that has a unionized work force.

Forty-five states plus Washington DC have implemented policies and procedures that support EVs’ advancement. Only Kentucky, Kansas and North Dakota apparently don’t have any EV policies in place according to the National Conference of State Legislatures.

California is the single state that has set a specified goal mandating a stipulated percentage of EV sales to be purchased by a specific year, in addition to other EV incentives. Gov. Gavin Newsom signed the enabling Executive Order in September 2020.

California’s specific EV goals were formalized last month. The goals require 35% of new passenger vehicles sold in the state by 2026 to be zero-emission vehicles (ZEVs), powered by batteries or hydrogen. Less than a decade later in 2035, the state mandates that 100% of all new car sales will be free of the fossil fuel emissions. To portray these goals as aggressive is to notably understate the challenges that must be met for success. In a mere 4 years from now California EVs sales will need to almost triple. Total US vehicle sales increased 3.4% in 2021.

The state’s EV goals will be administered by its principal environmental organization, the California Air Resources Board (CARB) within the California EPA. The CARB has disproportionately large influence on US environmental policy because 15 other states and the District of Columbia have adopted California's stringent emissions and vehicle mileage standards as their own. The CARB set its first auto fuel efficiency standards in 1990, others followed. They were and remain very strict, have never been actualized on schedule and thus have been postponed many times. I expect the 2026 EV market goals likely will be postponed, as well. The CARB EV standard states what type of vehicles can be sold and operated in the state.

Assuming that annual California vehicle sales increase at 3.24%[1] between 2022 and 2026, over 759,000 EVs will need to be purchased in 2026 to satisfy Gov. Newsom’s EV mandate. Admittedly, this growth rate is much lower annual vehicle sales growth rate than recent history, due to Covid and supply constraints. But 759,000 EV sales in 2026 would represent a colossal 3 times as many as EV sales than happened in 2020.

Simply creating an official ukase that 35% of 2026 vehicle sales will be EVs is as naïve as it is insufficient for making it actually happen. Politicians cannot mandate that private individuals must buy a lot more EVs by 2026, only that EVs will be available. How is Governor Newsom along with Liane Randolph, the Chair of the CARB, going to convince California consumers to buy more EVs. To save our environment, someone will need to motivate most Californians to stop buying fossil-fueled vehicles like they have been for over a century. Changing our car-buying habits will take a lot of motivating that so far is utterly lacking. Federal and state incentives are solely financial – rebates for EV purchases – which is necessary now but wholly insufficient to quickly modify long-term public behavior.

Recent history provides little solace for the Governor’s, Ms. Randolph’s or others’ potential EV marketing efforts. The majority of California’s car buyers have consistently refused to consider the CARB’s previous EV vehicle mandates and incentives when contemplating a new car purchase.

Most EVs remain expensive despite offered incentives. Potential EV buyers still contend with range anxiety issues. The state’s public EV infrastructure, aka charging stations, remains spotty, insufficient and unmaintained. California now has one of the country’s worst availability records of charging stations for EV drivers, just one station for every 31.2 ZEVs. This  ratio is almost ten times inferior than North Dakota’s (3.18 ZEVs). Who would have guessed the Peace Garden state is the nation’s leader? A survey of 181 Bay Area charging stations revealed that 23% had either non-operable screens, payment system failures or broken connector cables. Non-functioning charging stations will not ameliorate range anxiety.

If politicians want cleaner air via EVs, they better do several things: start building multitudes of additional, fully-maintained EV charging stations before more EVs are sold, and mandate standardized construction of far quicker charging level-3 public stations. California is planning to increase the number of public charging stations. It’s unknown if they will include standardized level-3 charging ports or how well they will be maintained.

California deserves praise for leading the US in its quest towards a cleaner, healthier future for transportation and the environment. The likelihood of significantly higher federal investment in EV incentives and infrastructure is low, given the BBB’s demise. California and other states will need to up their ante if EV sales are to substantially increase. This will entail sustained public investments that will effect colossal changes in the public’s vehicle purchase behavior. Such investments should include persuasive marketing campaigns that focus on the general car-buying public, not wealthy purchasers of Porsche Taycans or Tesla Model Xs.

Improved public management of an expanding EV system is essential. Hopefully, challenges will be addressed and quickly surmounted. Otherwise EV sales will remain far below policy-makers’ aggressive goals.


[1] California vehicle sales will increase 3.24% between 2021 and 2022, according to California Auto Outlook. 


Wednesday, March 30, 2022

LOOSER LABOR AND TIGHTER MONEY

Disorder in the house, Time to duck and cover. ~ Warren Zevon 

After several years of relatively benign macroeconomic circumstances that are based on impressively large fiscal programs and loose, rock-bottom interest rate monetary policy, the past year has become more exigent.

First, several millions of us have been engaged in the Great Resignation that’s contributed to an ever-tightening labor market. Second, the government has spent over $5 trillion (T) so far fighting an insidious ever-altering virus and passed a $1.2T decade-long effort to improve our aging infrastructure. Spring’s hopes rest eternal. But notwithstanding everyone’s hopes, Covid will not be going away, ever. Covid’s latest variant, BA.2, is leaving its dark mark across the Atlantic and beginning to here, as well. Let’s hope an added booster can make a difference.

In addition to the much-increased public spending, frazzled supply-chains have also pushed annual inflation to the highest levels in four decades; 7.9% at last measure. For the year ending February 2022, the Federal Reserve increased nation’s money supply by 11%. Given such loose money, together with Congress’s expansionary fiscal efforts, no one should be surprised that inflation has risen.

Despite all-too-tardy statements from the Federal Reserve Board’s chair Jerome Powell that inflation was “transitory,” it has continued and grown. Oops. The current elevated inflation level will be present for an extended period. In their overdue response, the Fed has just begun raising its key interest rate (the Federal Funds Rate, FFR) by 0.25% and started tightening our money supply, as depicted below.


Tighter Money

As post-Friedman monetarists, Jerry P. and his Board buddies (as well as Joe B. in the White House) hope this FFR increase, together with expected later rises will soon temper inflationary price boosts. But not so much that the economy shifts into dreaded “stagflation” territory –stagnating growth concurrent with inflation.

Antediluvians like me remember living through the nasty stagflation-full 1970s when oil prices rose big-time, together with macro price upsurges and diminished growth. They were most definitely not the good ol’ days, especially then. That bout of stagflation required the Fed to launch a painfully corrective, multi-year recession to “cure” it.

This existing inflation is likely to be bad news not only for us consumers. It’s a grave omen for Dems’ November election chances, especially after BBB became Build Back Never.

And that’s not all. For the past month, the US has been fiscally fighting a war in Ukraine, an impressive young Eastern European democracy. This horrific, unprovoked conflict is being waged by Russia’s kleptomaniac modern-day Czar, Vladimir the Terrible.

Beyond horrible human suffering, this war has fractured world commodity markets. That’s because Ukraine and Russia are crucial suppliers of several important products. Together they export over 25% of the world’s wheat, 16% of corn, 30% of barley and 80% of sunflower oil and seed meal. No one now expects any of the winter wheat planted last fall in Ukraine, the former “breadbasket of the Soviet Union,” to be harvested this summer. Ukraine also provides about 50% of the world’s neon supply, required for manufacturing microchips.

Russia is the world’s third-largest oil producer behind the US and Saudi Arabia; the second-largest producer of natural gas and supplies roughly 40% of the European Union’s natural gas needs. Russia is the world’s top exporter of nickel (essential for EVs’ battery production) and palladium (required for cars’ catalytic converters).

Prices for these crucial ingredients have risen significantly, which will soon add to many products’ costs beyond Ukraine or Russia. For example, two weeks after Russia’s incursion into Ukraine the world price of wheat is no longer loafing. It soared 41.2% above the pre-war price. Most recently the price of wheat settled to merely 23.3% above that price. Ouch.

Let’s change the discussion from dismal commodities to promising communities, focusing on recent changes in our harried labor market. The Great Resignation began in April 2021, when almost four (4) million workers quit their jobs. The quitters include older near-retirement Boomers and a larger number of Millennials and Gen Zers. Principal reasons for their departure included low pay, no advancement opportunities and feeling disrespected at work.

But what’s happened to all these people who’ve left their jobs during the Great Resignation? It’s hard to find any direct information about whether the quitters have found more meaningful and more respected jobs.

Pay has definitely risen. Labor compensation across the US rose 5.5% in 2021, although after accounting for inflation, 2021 real labor compensation fell 1.1% according to the Dept. of Labor. Companies are paying higher wages as well as offering signing bonuses to entice (and retain) workers. Fortuitously, this tight labor market seems to be reducing pay inequality, as lower-paid workers’ compensation has risen more than other workers’.

Nevertheless, the demand for labor from employers continues to outstrip the availability of workers interested in returning to the labor force. Thus, job prospects for workers are brighter than they have been in several decades. Unfilled job openings in February remained at near record levels. Workers who voluntarily resigned their positions increased to 4.4 million last month.

A ”greener grass” factor also is playing a role in workers’ quitting their current jobs. This factor may be most driven by Gen Z, who now comprise more than one-quarter of the workforce, and who might be joining a new firm thinking their new work-gig will be a more-fulfilling dream job. After a short time, reality may strike.

A recent survey of new hires found that almost three-quarters of them experienced either “surprise or regret” that the new position or new company they quit their job for turned out to be “very different” from what they were led to believe. Nearly half of these workers said they would try to get their old job back.

Realistically, the grass more often than not is pretty much the same color green at the new job as it was before, despite hopefully better espresso. Particularly if the newly-hired worker places importance on the company’s values matching their own, and on the firm’s hints that plentiful career development opportunities are very near their cubicle. This job change shock may be caused by a certain amount of naivety among the Great Resignees. Also, it’s more likely to happen in smaller firms, where satisfying such desirable but encompassing career goals can be challenging.

Although there are no actual numbers, it’s likely that a fair number of resignees decided to go their own way and establish their own new businesses. After all, American commerce is replete with memorable tales of adventurous entrepreneurs succeeding after beginning in a garage or similar petite places. New applications for federal tax ID numbers jumped 56% in the past two years. There’s been a 5.3% increase in the number of self-employed workers. This may be an impressive set of new entrepreneurs, a few of whom may beat the large odds and succeed. The Small Business Administration’s data show that 90% of start-up businesses fail sometime during their first five years.

My bet is that workers will soon begin to boost their so far leisurely return to working. Why would this loosening of the labor market happen? Three reasons; first, evermore workers who have been sitting on the labor market’s sidelines have depleted the stimulus check funds’ cash they received last year. Second, labor-force participation for workers aged 25 through 64 has been steadily rising, and is now close to what it was 18 months ago. These folks have not resigned and withdrawn from working. Instead, most folks who’ve “resigned” have actually been frictionally unemployed, and rapidly found new, presumably better jobs. March unemployment was at a rock-bottom 3.6%; employment rose by 431,000 folks.

Third, total household debt last year increased almost 7%, the largest annual increase in over a decade. Car loans are a large factor; the hyperactive housing market and booming credit-card balances are others. Receiving paychecks will help America’s households that are on the fiscal hook for delivering larger monthly debt payments. 

The loosening labor market and tighter money – the opposite of what we’ve recently lived with – can lead to better days, the sooner the better. Let’s hope the Fed can somehow thread its monetary needle into a macroeconomic soft-landing without a trace of recession. Otherwise it’s time to duck and cover, as Warren Zevon declared.


Friday, February 25, 2022

THE DEMS, COVID AND SCIENCE

Humanity is now in its third year of battling the SARS-CoV-2 virus (aka Covid). We have become frightened, pained, upset and wounded, as well as wearied and drained. Even Democratic Governors –  from California to Connecticut – have been announcing relaxed rules for dealing with Covid during the past three (3) weeks.

Today the CDC finally issued new, eased and science-based Covid guidelines, following the relaxation already begun at the State level. The CDC guidelines focus on preventing hospitals and health care facilities from being overwhelmed, rather than prior guidelines that emphasized eliminating the transmission of Covid among people. I doubt the CDC would have issued their new guidelines now without being forced by the governors’ prior decisions.

Can we breathe an un-masked sigh of relief? Hope springs eternal. Such hope may now be especially appropriate since Spring will formally appear in less than a month. But what about the BA.2 variant that’s now entering our viral stage?

Throughout this ever-shifting pandemic, Dems have consistently proclaimed their allegiance to “following science” as the only valid way of overcoming this virus. It’s seriously doubtful we will ever overcome Covid. But thanks to vaccines and other health care improvements, we may be able to live with it endemically, as I mentioned in a previous blog .

The Dems’ following science mantra is necessary for Covid policies’ groundwork, but the mantra may not be sufficient as a policy justification. The vaunted Scientific Method, which western science has used for over 400 years, has promoted significant, broad-based societal benefits. Despite this impressive chronicle, many Repubs seemingly beg to differ about using science. That’s farcical.

In contrast, by emphasizing their policies follow science, the Dems seem to believe they can circumvent stating other relevant justifications. That is mistaken. Two issues test this mantra’s policy efficacy. First, certifiable medical science can take considerable time to become digested from its beginnings in academic or private labs into medicines and practices, and finally public policies. Second, science rarely proscribes only one solution. There’s often more than one scientific way to achieve an objective. Each way invariably requires trade-offs to be considered and resolved. Numerous scientific results are controversial at first. In a sense, such trade-offs and resolution are at the heart of the Scientific Method.

A brightly shining star in Covid’s firmament has been the impressively quick commercial development of the vaccines. The first person in the US was inoculated with a Covid vaccine on December 14, 2020. The mRNA vaccines’ production took just a gold medal sprint worthy 11 months to be produced, authorized and shot into arms.

But that swift production of mRNA Covid vaccines required a foundation of basic, scientific research and knowledge that began long ago in the early 1960s. One of the pioneering scientists whose interest in mRNA vaccines began in the 1970s is Katalin Karikó, who is now Senior Vice President of BioNTech. BioNTech, together with Pfizer, has provided 324 million Pfizer-BioNTech mRNA Covid vaccine doses in the US.

The Dems have inappropriately hoisted “following science” as a needed policy pinata, shown below, that will ensure the production of unambiguous, universal guidance for how we should deal with this pandemic. If an FDA or CDC policy is science-based, as these agencies’ policy-makers and the president routinely state, it must be right. If only.


The Dems' Covid Pinata 

Numerous groups, disagreeing with such guidance for assorted reasons, have persistently attempted to sling sharp pokes into the Dems’ follow science pinata. They have yet to be showered with treats, but they keep on trying.

Historically, empirically-based scientific inquiry has produced many valued changes that have fundamentally altered and improved how we see ourselves, our world and beyond. An apocryphal apple falling on Newton’s head is but one example.

Scientific inquiry is never static. Scientific knowledge regularly evolves as more data are gathered and new theories are postulated to describe them. Scientific findings on many topics of public interest cannot be carved into a Mt. Rushmore for all time. Here are two examples from the past.

The heliocentric model of the heavens.  Talk about fundamental changes. When Copernicus first suggested that the universe did not revolve around our Earth it was a big deal for those in the know – meaning the Catholic Church. Geocentrism – where the Earth is placed at the center of the heavens – had been accepted wisdom from on high for eons. In 1543 Copernicus first proposed an alternative sun-centered (heliocentric) model of the heavens. Astronomers and others will celebrate his 550th birthday next year.

In 1609, Galileo defended Copernican heliocentrism based on his own, original astronomical observations. For that he incurred the Catholic Church’s unrelenting rath. During the Roman Inquisition in 1615 Galileo was found to be a nasty heliocentric heretic and placed under house arrest until he died nearly 50 years later. Yet the cloistered Church could not stop the heliocentric sun from shining in.

The theory of evolution.  Charles Darwin and Alfred Russel Wallace offered their ground-breaking research about evolutionary natural selection in 1858 at London’s Linnean Society. The next year, Darwin published On the Origin of Species by Means of Natural Selection that was hugely controversial and consequential. Quixotically, it still remains provocative for a few people mostly on theological grounds. After the late-19th century, natural selection has become a foundational cornerstone of modern biology. But folks still petition school boards to stop teaching evolution to their children, not just CRT.

There is no unique, unambiguous prescriptive policy to cure our Covid dilemmas. Policies must change as Covid-reality varies. Science-based policy options involve shortcomings as well as benefits. These trade-offs need to be recognized and discussed. Invariable remedies do not spring forth because they have been wrapped within a mantle of science. Pronouncing policies as “following science” does not obviate the need to acknowledge their trade-offs.

Discussing these trade-offs is key. That’s not something that Dems or policy-makers at the FDA and CDC have seemed comfortable doing in prior stages of the pandemic. The Dems would be wise to cease characterizing their policy remedies as loftier simply because they’re following science and take a more holistic, inclusive approach.


Friday, January 28, 2022

IS THE SUN SETTING ON CALIFORNIA’S SOLAR ROOFTOPS?

Truth is like the sun. You can shut it out for a time, but it ain’t going away. ~ Elvis Presley 

California has long been the sunniest place in America. Californians have installed solar photovoltaic (PV) panels on 1.3 million of their homes, the largest number of rooftop installations of any state. Hawaii is also sunny, duh; its solar installations are numero uno on a per capita basis. But the Aloha State’s total solar installations represent just 7.4% of California’s.

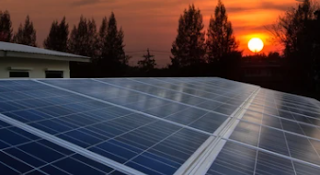
The Golden State’s solar rooftop expansion began in 2006, when then-Governor Arnold Schwarzenegger signed into law the million solar roof’s initiative. It has been impressively-successful in reducing the state’s production of fossil-fueled greenhouse gases (GHG). But the sun may be dimming soon for solar roofs, just like this picture shows.  

A setting sun for California’s solar rooftops?

In addition to being sunny, California is also one of the most committed states in rectifying economic inequity. One of the latest efforts involves municipalities branching out to plant more trees in “underprivileged” and “low-resource” areas to mitigate inequitable, “racist housing policies.”

Colossal Los Angeles and much-smaller Richmond are but two California cities that have initiated vigorous tree-planting programs that will eventually spread natural shade and coolness across more urban neighborhoods. These are great, greening efforts that will take a long time to produce significant shade.

But there’s no stopping in California with just saplings to alleviate inequity. Nope, in the name of inequity relief, the California Public Utilities Commission (CPUC) soon may significantly cloud the state’s bright efforts that reduce nasty environmental emissions via residential rooftop solar arrays.

How could this be? If it happens, you can thank short-sighted equityists within the CPUC staff and maybe the Commission itself, as well as the state’s private utilities. The utilities have always been dismayed about rooftop solar electricity generation they don’t own and earn no money from.

These solar critics are short-sighted because they see solar’s current NEM (net energy metering) protocols only from the cost side (what customers pay), allegedly harming low-income non-solar rate-payers. The critics entirely dismiss the actual substantial benefits that solar provides communities.

The CPUC will soon decide whether to diminish significantly the incentives for homeowners to install solar. Why? Because the CPUC staff as well as privately-owned electric utilities believe non-solar, low-income electricity customers pay disproportionately more under current California rules than owners of rooftop solar systems. That’s not equitable and thus must go.

I am not a disinterested party to these considerations. We installed solar PV (and thermal) panels on our roof 12 years ago. It’s a modest 2.8kW array (there’s no need for AC cooling here in fog city) that now has probably just paid for our initial investment due to California’s time-of-use NEM mechanism that reduced our electricity bills.

I am very interested in having the PUC recognize that solar NEM’s benefits transcend direct dollars and cents advantages. A principal benefit of solar generation is reduction in GHG emissions that aids everyone, no matter what their income and whether or not they’re a solar customer.

Does the PUC wish now to create disincentives in the name of equality for solar’s continued ascendency? If the CPUC accedes to the utilities’ cynical support of “solar equity,” it will require increased use of natural-gas powered generation. Dirtier kWh will be produced to the benefit of the utilities, with subsequent harm to all.

California’s solar industry is the nation’s largest. It directly provides about 65,000 jobs and produces more energy than nuclear and coal combined in the state.[1] Last year solar rooftops delivered 9% of California’s total electric production, the largest of any renewable resource.

Governor Gavin Newsom has embraced both a renewable energy goal of procuring 50% of retail sales from renewables by 2030 (it’s 33% now), and of reaching 100% renewable energy production by 2045. These goals depend on continued growth in solar rooftop energy production. Neither objective will be achieved if the PUC reduces solar incentives.

The governor’s July 2021 report, California’s Electricity System of the Future states, “solar and wind build rates need to nearly triple” in order to achieve his 2045 100% renewable energy production goal. Solar will never triple production if the CPUC changes its solar NEM rates, as planned.

The CPUC’s proposed plan will shred by over 75% how much residents would get paid for electricity generated from their rooftop panels. In addition, it proposes sharp increases, about $60/month, in grid-access charges for a typical solar customer.

In effect, the plan virtually eliminates the monetary incentives that have continued to support more homeowners’ investing in solar. These investments often require paying thousands of dollars up front to install rooftop PV panels.

So far, Gov. Newsom has shirked his duty to strongly and publicly support continued solar incentives like NEM.

Perhaps he’s scared of upsetting the utilities and the IBEW, the principal electric utility union who’s prominently in favor of reducing rooftop solar incentives. The union wants to cash in on lucrative PV panel installation jobs by the utilities that they don’t enjoy now. Maybe the governor also doesn’t really believe in the environmental goals he’s previously stated were vital.

Do Gov. Newsom and the CPUC want to re-monopolize California’s largest utilities at the expense of environmental degradation to gain a sliver more equality? So far, it seems so.

I recommend he have at least one private conversation with CPUC decision-makers encouraging them to relieve some underprivileged customers’ issues without darkening solar’s clear environmental benefits. The benefits he’s counting on to meet his popular environmental goals. Maybe the CPUC could extend these customers’ baseline (low-cost) consumption block to provide relief, or at the very least, adopt a far less extreme reduction in rooftop installations’ incentives.

The Commission might welcome such informal communication because it’s not batting at full strength now. The new CPUC President has been in her job for only 20 workdays and one of the five Commissioner chairs remains vacant.

In any event, the sun must continue to shine on California’s ever-growing solar rooftops for all our sakes.


[1] Speaking of impending environmental challenges, California’s last operating nuclear power station, PG&E’s Diablo Canyon, will begin to shut down late next year. Nuclear, including Diablo Canyon, has many faults and it produces no GHGs. 


Thursday, January 20, 2022

JUST LIVING WITH COVID

Everybody’s headed for a hole in the ground. ~ Warren Zevon & Duncan Aldrich 

It’s been 25 months and more than 5.5 million global deaths since the insidious Covid-19 pandemic began. The World Health Organization (WHO) properly declared a public health emergency of international concern a month after this virus was first discovered in Wuhan China. How long will the Covid-emergency last? How long should it last? When can we just live with Covid?

Coronaviruses began infecting humans in 1965. They caused the SARS and MERS outbreaks in 2002 and 2012, respectively.

Virologists believe Covid will be with us for a very long time, just like the H1N1 virus that jumped to humans producing the 1918 Spanish Flu, which killed 675,000 Americans. The H1N1 virus is still with us; it’s now one of the strains in the seasonal flu virus.

Despite politicians’ and policy-makers’ fervent proclamations that Covid will be “conquered” and “vanquished,” it won’t be. Why? Because it’s a virus, it mutates constantly, forever. It won’t surrender even to our fully-modern medical technology. Like every other infectious disease-producing virus, it’s here for ages. The single exception to this eventuality was the smallpox virus that was eradicated world-wide in 1979, nearly 200 years after a vaccine was first produced, and after killing an estimated 900 million humans during its reign.

As we enter the third year of this pandemic, the question has been raised: how we can learn to live with Covid on an ongoing basis. Other questions include determining what continuing, non-emergency policies will sustain our ability to live, play and work alongside the presence of Covid, like we have done with the flu virus and many others.

Several prominent former members of President Biden’s Covid-19 Advisory Board have recommended creating “New Normal,” non-emergency health policies that will allow us to survive more safely with Covid. Their recommendations essentially involve strengthening the role of US public health agencies by improving and sustaining public health infrastructure. Such strengthening would involve significant, continuing federal and state funding, which, perhaps wisely, they did not enumerate.

The mystery isn’t only about what our Covid policies should become, after suffering so much in this enduring pandemic. There are others as well.

Because they don’t leave any fossils, it remains mysterious as to what viruses really are and have been. Many scientists believe proto-viruses began replicating on Earth several billion years ago. They have a giant head start; the earliest modern homo sapiens have been doing this for perhaps 300,000 years.

These virologists subscribe to the virus-first premise: Long, long ago, viruses evolved from molecules of protein and nucleic acid, before cells first appeared on Earth. Thus ironically, viruses themselves contributed to the development of cellular life.

The first human virus was scientifically identified in 1881, the yellow fever virus. During the past century scientists have changed their minds several times about what viruses are. They were first seen as poisons (the word “virus” is derived from the Latin term for poison, venenum), then as an elementary life-form and finally as biological chemicals.

Virus devaluation to inactive chemicals began 86 years ago, when biochemists determined that viruses are not alive. On their own they cannot produce life-required metabolic functions, such as conversion of food/fuel into energy to run cellular processes.

Viruses’ hosts provide these necessary functions, not the virus itself. Unfortunately, viruses can and have infected virtually every earthly life-form, from humans and insects to tobacco plants and bacteria. Some virologists believe viruses may occupy an enigmatic grey area between living and nonliving. Perhaps similar to what certain Dems believe Trumpists are.

They may not be alive, but the microscopic Covid viruses have affected hundreds of millions of people during the past two years, and will continue to do so all the way to its omega variant (which is 9 variants after omicron, if you never had to memorize the Greek alphabet like I did long ago) and beyond. This virus’s persistence – which, politicians, policy-makers and the rest of us should have previously acknowledged – has precipitated growing relevance for changing short-term, emergency policies to ones that support our need learn how to “live with it” (the Covid virus) over the longer-term.

It can’t be an emergency forever, as an infectious disease expert aptly phrased our current policies.

How can policies be changed from considering Covid not as an emergency, but as an ongoing epidemic? Increasing Covid vaccination rates is the most important objective for living with it. Shown below is one of a growing number of pop-up vaccination clinics.  Regrettably, it’s also the most problematic, given the political caste and personal reluctance that now surrounds vaccination. Next in line is widespread use of masks. The fragile nature of some healthcare systems also poses problems.  

A pop-up vaccination clinic in action.

Achieving this objective will be challenging and increasingly expensive. The “easy arms” have already been injected. At the moment, the US has a fully-vaccinated rate of 63%, much below what epidemiologists used to, but no longer talk about in terms of Covid’s Herd Immunity rate might be.

Medical personal directly involved with immunization describe the current process of getting reluctant folks to be inoculated as “a very grinding, slow process” that’s akin to “medical trench warfare.”

This is especially true after the Supreme Court’s misguided decision last week to block government-mandated shots by companies with more than 100 workers, who employ 67% of our labor force. The Supremes can no longer be relied on to support public health, among other issues. Itself a tragedy within a tragedy.

Interim policies that have been recently initiated should increase availability of take-home Covid tests and oral anti-Covid medicines. Other “living with it” policies once hospitalizations stabilize and decline may ultimately include modifying restrictions on: mask usage, isolation periods, travel, public and private meetings, social distancing, K-12 and college closings, restaurants, quarantines and business hours/operations.

To be successful in reducing Covid’s substantial negative externalities, such guidelines require everyone to comply. Those who willingly damage public health by non-compliance of vaccination and eased, non-emergency Covid-mitigation policies should result in added limitations-consequences for those people. Such compliance consequences would be completely consistent with existing, mandated inoculations in order for children to attend day care, pre-K and K-12 schools.

“Living with it” policies will require “get with it” public compliance. Here’s to a brighter, healthier future. 


Saturday, January 1, 2022

URBAN TRANSIT, STUCK BEYOND THE SHOULDER

It was a nightmare. The band had to tour Greenland by bus. ~ Fred Schneider, a founder of the B-52s 

Have you ridden a bus, hopped on a subway or taken a train recently? Fewer folks than ever have been using public mass transportation to get places near and far. The resurgent Covid pandemic hasn’t helped. Local bus and rail systems – public mass transit – remain stuck, beyond the shoulder of thoroughfares that count, as both customers and transit drivers have abandoned them.

Mass transit is not a pedestrian matter; its status affects millions, can alter our environment and over time has been influenced by many factors. In econo-speak, mass transit has been considered an inferior good, one whose demand declines as consumers’ income rises. It wasn’t always inferior.

After my mother graduated from the University of Massachusetts during an early stage of the Great Depression, she boarded a Greyhound bus in Boston and over the next six months travelled around the country. To visit friends, she first headed to Florida and then across the deep south and south-western US to Los Angeles, where stayed nearly a month. From LA she took train rides on the Union Pacific, Pennsylvania and New York Central railroads during a 5-day jaunt back to Massachusetts.

At that time, trains and buses were the most popular means of travelling long distances. Greyhound had over 4,800 stations across the US. Railroads’ passenger carriage was more than five (5) times what Amtrak’s is now.

Public transit ridership has never since been higher than it was in 1926. Automobiles were certainly present then, but were not nearly as fast or convenient for a single person undertaking a long, cross-country trip. My mother saw first-hand the sights of America at ground-level, riding Greyhounds and the rails. The picture below shows the classic Scenicruiser bus, designed by Raymond Lowey, that Greyhound operated for about 20 years.

A great deal has changed in mass transit during the past 80 years, most of it unfavorable. Municipal transit systems have been owned and operated by city and regional governments since the 1950s. Greyhound remains the country’s largest inter-city motorcoach operator, but now operates in less than 60% of the cities it did at its peak before WWII.


The Greyhound Scenicruiser bus, used from 1954 to the mid-1970s.


Transit ridership essentially plateaued with subsequent gradual declines for decades, as the automobile gained dominance. President Eisenhower’s groundbreaking federal funding of the Interstate highway system in 1956 confirmed the government’s commitment that it needed to meet the increasing challenge of evermore cars on US highways. 

It wasn’t until eight years later that the government first began providing sizeable financial assistance to local transit systems with the passage of the Urban Mass Transportation Act (UMTA) in 1964. The UMTA funding paid for two-thirds of the costs of local transit systems’ equipment and facilities. By the 1970s this federal funding had allowed cities to build new, heavy-rail mass transit systems like the San Francisco Bay area’s BART, Washington DC’s Metro and MARTA (not our first president's wife; it's Atlanta's subway system).

During the 1980s and thereafter many cities built less capital-intensive light-rail transit systems, including Philadelphia, St. Louis, Seattle and San Jose. Light-rail, surface systems operate on dedicated rights-of-way with power provided via overhead wires. These additions to cities’ transit coverage have been helpfully modernizing.

Despite this sizeable public investment, the share of US workers commuting by public transportation fell from 12.1% in 1960 to about 5% in 2019. Annual growth in public transit ridership is a minute 0.6% since 2000. Adding to urban transit’s miseries, current ridership now is less than one-half of what it was pre-Covid.

Transit advocates advise that the costs of urban driving are too low and need to increase if transit is to recover ridership. This could involve instituting congestion fees, increasing parking costs and pumping up state and local gasoline taxes.

Manhattan, NY now appears to be edging back onto the roadway for implementing substantial congestion fees. It may work in Manhattan, but it’s not clear there are many politicians willing to brave public resistance to elevating driving-related fees and taxes. Travelling that political pathway to change decades of commuting behavior is likely to be a fully pothole-filled trail.

In November, President Biden signed the $1.2 trillion (T) Infrastructure Investment and Jobs Act. This legislation’s fiscal largesse will be spread wide and far. Confusingly, this trillion-dollar number is not the amount of actual new infrastructure spending. Nope. The large, legislative budget number also includes typical annual expenditures for public roads, bridges, ports, railroads and water infrastructure, such as filling potholes, replacing worn-out pipes and equipment and operations & maintenance expenses.

New expenditures in the bipartisan Infrastructure Act sum to about $550 billion (B). This hefty number represents only 46% of the Act’s total $1.2T sticker-price. It’s these new outlays, not pothole-filling, that the president and Dems proclaim will significantly improve America’s transit infrastructure and consequently its citizens’ lives.

Such efforts will hopefully benefit many folks in many ways, which is a good thing. But this confusing reporting of funding level is an example of how Congress swells the apparent significance of its legislative efforts. Dems believe bigger is clearly better, even though it’s misleadingly stated. So it goes.

Public transit is due to receive $39B, 7.1% of new infrastructure expenditures. This tidy sum will serve to upgrade our 2,200 public urban and rural transit systems nationwide. The Act will also provide money to create new bus routes, electrify bus fleets and assist in making public transit more accessible to seniors and disabled Americans. Interestingly, urban rail lines are already reported to be at least 90% handicap-accessible; buses are 99% accessible.

Berkeley has its own ideas for improving its bus system. The City Council is considering a program that will offer free AC Transit bus rides in a portion of the city. If the Council approves, if they find funding for it and if AC Transit (the bus operator) agrees, one bus route that travels through several low-income neighborhoods will be renewed and fare-free on Sundays for a year. That’s three very big “ifs,” especially the last one. The Council believes this program would remedy in part systemic inequalities that Berkeley, being Berkeley, is very attuned to.

Among several issues with the program, picking Sunday as the free-fare day is regrettable. Sunday has the lowest ridership of any day of the week, and excludes virtually all commuters and students, the bulk of bus riders in Berkeley. Sundays are not a representative day of transit usage for most systems, including Berkeley’s.

The number of Berkeleyans who use buses regularly to commute to work is quite small, less than 8%. It’s not because bus fares are too high. Transit takes much longer to get places and ridership does not depend that much on fare level.

AC Transit studies indicate that reducing bus fares will not produce a significant or proportionate increase in ridership. Factors that promote bus ridership include the lack of a car for personal use, a positive assessment of buses relative to autos and close proximity to the bus route from one’s residence.

Unfortunately for transit, folks have become increasingly wary of traveling where crime and Covid may occur. As elsewhere, Bay Area residents are voting with their steering wheels to lower these risks, opting to drive and not use buses. AC Transit’s ridership dropped precipitously, 70% during the year ending April 2020. Now, its ridership is down a mere 60%.

Free fares are not going to solve these significant issues. It’s hard to imagine how this program will produce worthwhile information that could be useful beyond the one bus route that’s involved. But that’s not likely the true purpose of the program.

The Berkeley City Council has few qualms about undertaking this program that it’s not going to directly pay for. It could follow the Council’s well-established predilection of hurling other organizations’ money at issues like those facing underprivileged people in the hope that something useful might happen eventually.

With enough time, effort and searching, money will likely be found for this interim program. Possible funding sources include the American Rescue Plan Act and the new infrastructure Act. California expects to receive nearly $9.5B from the new Act to improve public transit infrastructure across the state. Berkeley stands ready to claim some.

However, AC Transit, who would have to implement the program, does not favor it as currently proposed by the city. Being very aware of the surrounding politics, AC Transit is on record supporting the idea of a free-fare program, just not this one. So far, Berkeley’s free-fare transit program, like public urban transit itself, seems parked far beyond the shoulder of transportation priorities.